Page Last Updated: May 15, 2026
StimTracker Artifact- detailed🔗
Effects of Artifact on ERP Derivatives by Task🔗
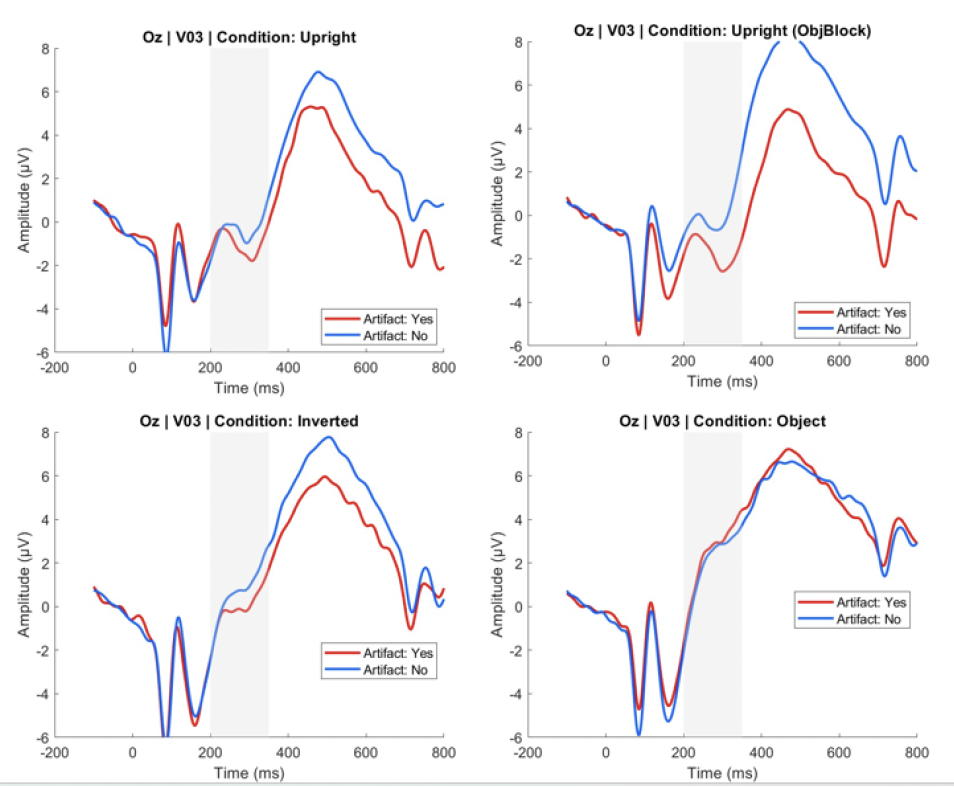
To assess the artifact’s impact on EEG derivatives, ERPs were computed for each task and ROI. Because there were many more artifact-free files, 100 artifact-present and 100 artifact-free files per task were randomly selected for comparison to balance the groups. Waveforms for each ERP are shown below, and differences by task and ROI are summarized in accompanying tables.
VEP🔗
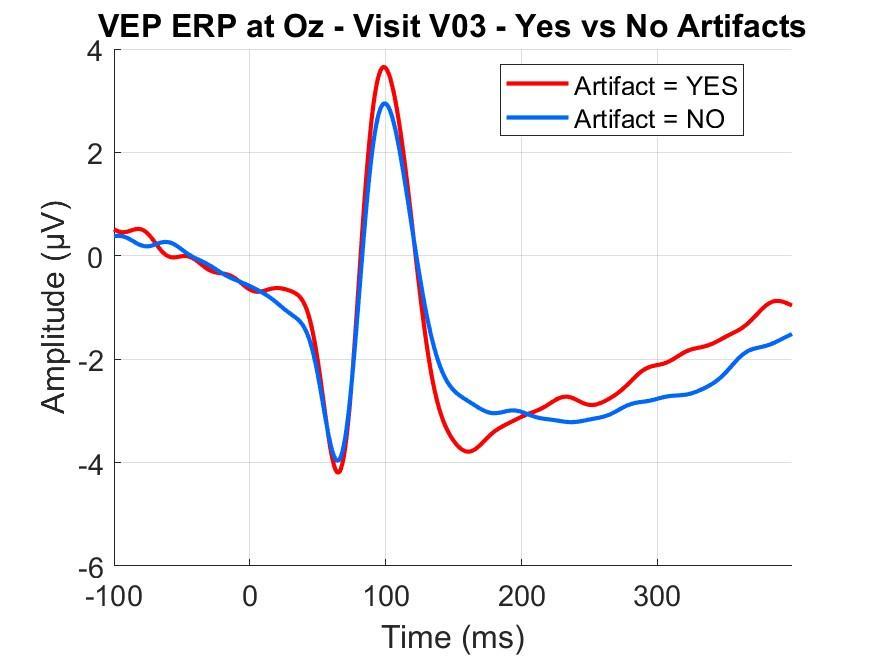
| Measure | N1 (40-79 ms) Mean Difference | N1 (40-79 ms) Significance | P1 (80-140 ms) Mean Difference | P1 (80-140 ms) Significance | N2 (141-300 ms) Mean Difference | N2 (141-300 ms) Significance |
|---|---|---|---|---|---|---|
| Mean Amplitude | Δ = 0.07 µV | p = 0.91 | Δ = 0.18 µV | p = 0.77 | Δ = -0.008 µV | p= 0.99 |
| Peak Amplitude | Δ = -0.43 µV | p= 0.55 | Δ = 0.67 µV | p= 0.37 | Δ = -0.56 µV | p = 0.49 |
| Peak Latency | Δ = -0.3 ms | p = 0.85 | Δ = 0.1 ms | p = 0.98 | Δ = -1.3 ms | p = 0.86 |
| Table 1. Differences in ERPs between the artifact containing (n=100) and artifact-free (n=100) files. Mean differences for mean amplitude, peak amplitude, and peak latency for the Oz cluster are presented for our time windows of interest. | ||||||
MMN🔗
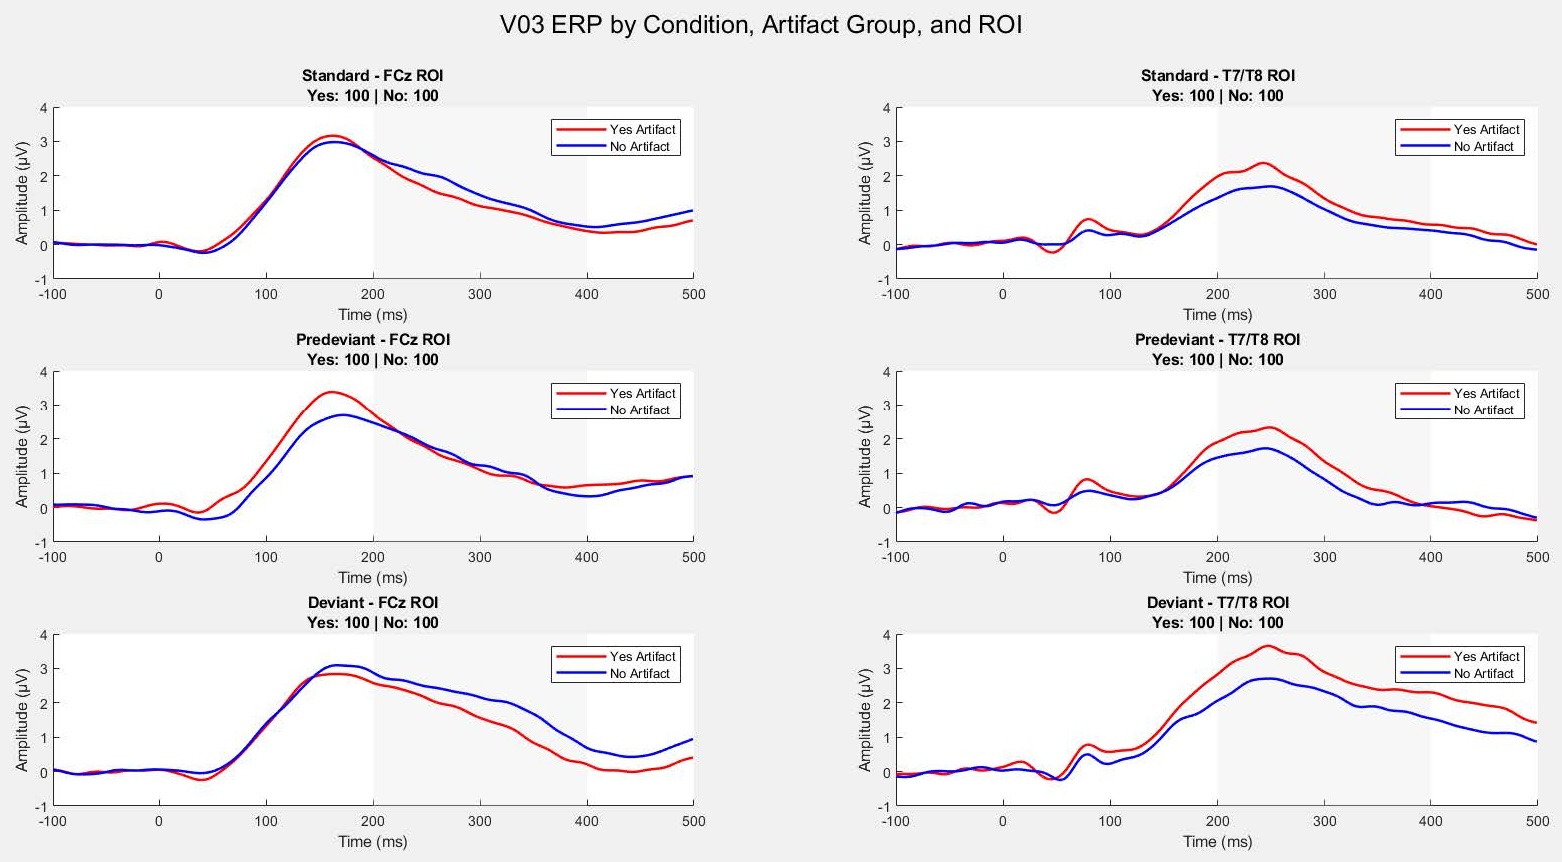
| Condition | ROI | Mean Amp Artifact (uV) | Mean Amp No Artifact (uV) | Delta (uV) | p Value | p Value Adj. (FDR) |
|---|---|---|---|---|---|---|
| Standard | FCz | 1.25 | 1.264 | -0.014 | 0.946 | 0.946 |
| Standard | T7T8 | 1.482 | 0.921 | 0.562 | 0.013 | 0.039 |
| Predeviant | FCz | 1.349 | 1.437 | -0.089 | 0.77 | 0.946 |
| Predeviant | T7T8 | 1.279 | 0.641 | 0.637 | 0.055 | 0.11 |
| Deviant | FCz | 1.478 | 1.444 | 0.034 | 0.927 | 0.946 |
| Deviant | T7T8 | 3.118 | 1.987 | 1.132 | 0.004 | 0.024 |
| Table 2. Differences between the artifact containing (n=100) and artifact-free (n = 100) files for the mean amplitude for each condition, ROI, and time window. | ||||||
Note: Differences between means are presented for each artifact designation, as well as the difference between them (delta). P-values were calculated for the differences between means, and then FDR corrected. Original and corrected p-values are presented.
| Contrast | ROI | Mean Amp Artifact (uV) | Mean Amp No Artifact (uV) | Delta (uV) | p Value |
|---|---|---|---|---|---|
| Deviant-Predeviant | FCz | 0.24 | -0.10 | 0.34 | 0.45 |
| Deviant-Predeviant | T7T8 | 1.70 | 1.03 | 0.67 | 0.10 |
| Table 3. Differences in mean amplitude for the difference wave of files containing the artifact (n = 100) and artifact-free files (n = 100). Contrast | |||||
FACE Task (by ROI)🔗
P7
P8
Oz
Fcz
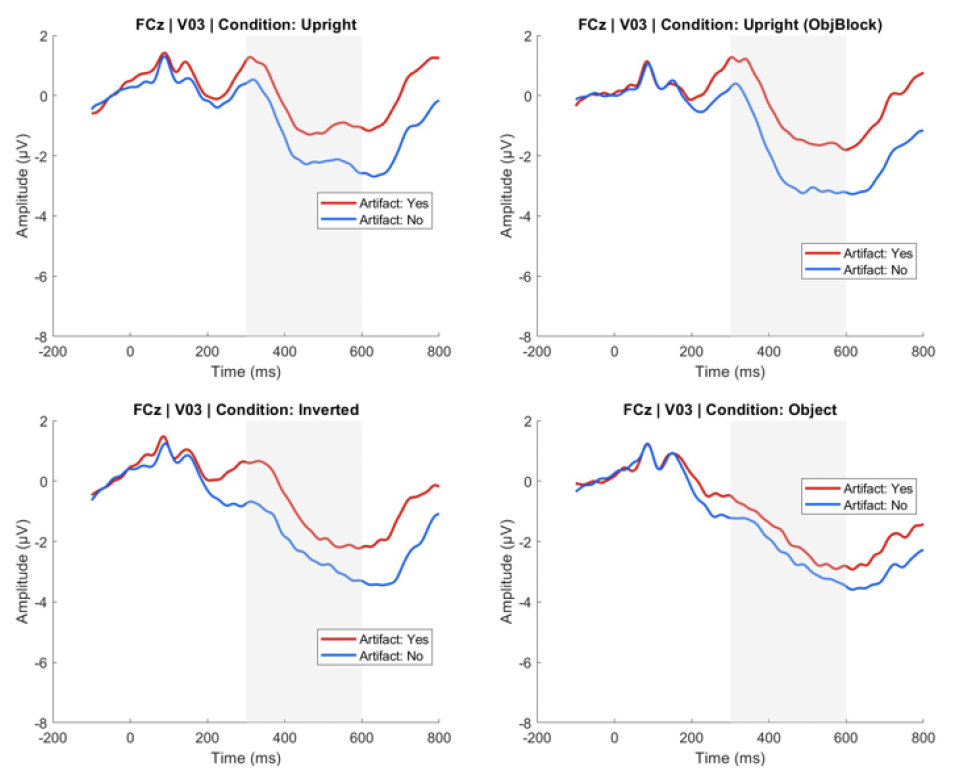
| Condition | ROI | Time Window (ms) | Mean Amp Artifact (uV) | Mean Amp No Artifact (uV) | Delta (uV) | p Value | p value Adjusted (FDR) |
|---|---|---|---|---|---|---|---|
| Upright (Inv) | FCz | 300-600 | -1.141 | -1.855 | 0.713 | 0.228 | 0.547 |
| Upright (Inv) | Oz | 200-350 | -1.38 | -0.922 | -0.459 | 0.668 | 0.836 |
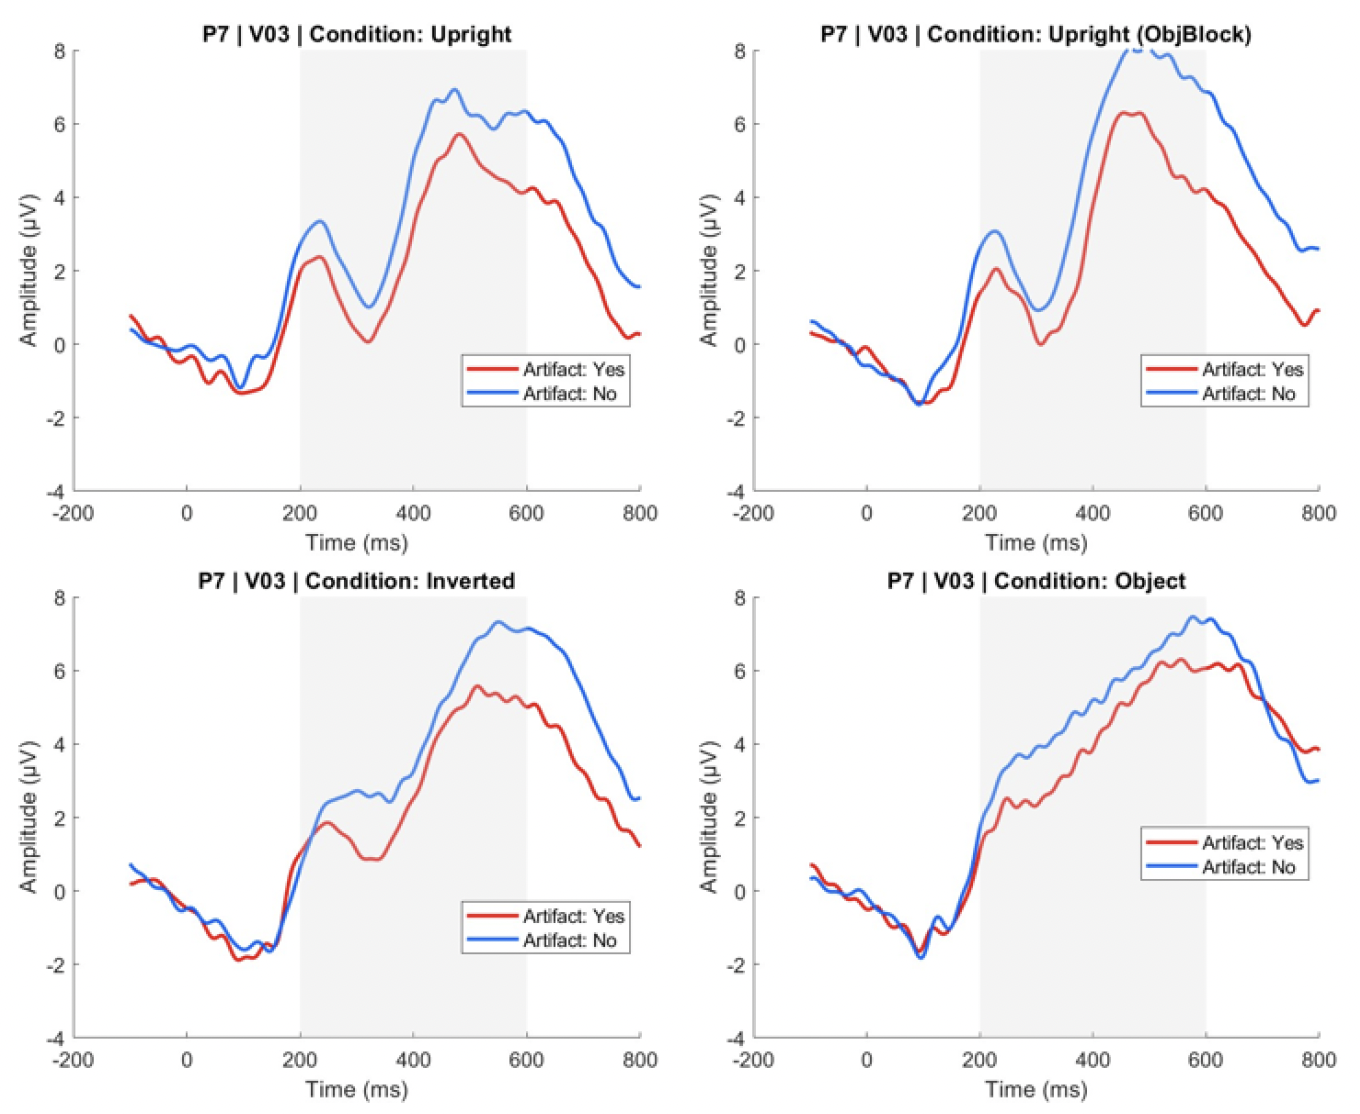
| Upright (Inv) | P7 | 200-350 | 1.418 | 1.445 | -0.028 | 0.971 | 0.971 |
| Upright (Inv) | P7 | 350-600 | 4.865 | 5.588 | -0.723 | 0.496 | 0.744 |
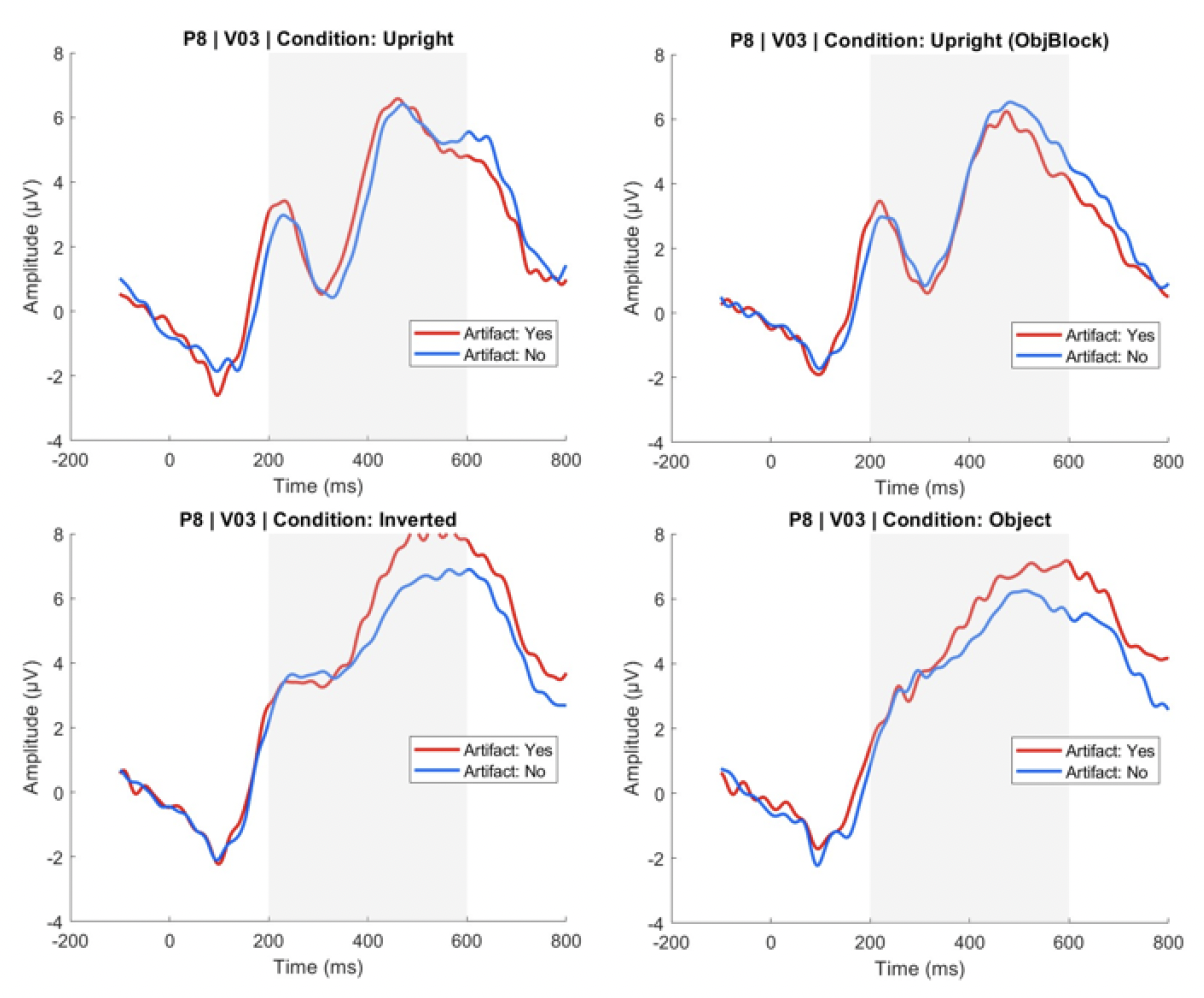
| Upright (Inv) | P8 | 200-350 | 1.933 | 1.705 | 0.229 | 0.789 | 0.836 |
| Upright (Inv) | P8 | 350-600 | 5.144 | 4.862 | 0.282 | 0.799 | 0.836 |
| Inverted | FCz | 300-600 | -1.353 | -2.074 | 0.72 | 0.18 | 0.54 |
| Inverted | Oz | 200-350 | -0.771 | 0.181 | -0.953 | 0.373 | 0.639 |
| Inverted | P7 | 200-350 | 1.648 | 3.367 | -1.719 | 0.03 | 0.18 |
| Inverted | P7 | 350-600 | 4.525 | 7.553 | -3.029 | 0.009 | 0.108 |
| Inverted | P8 | 200-350 | 2.728 | 2.958 | -0.23 | 0.801 | 0.836 |
| Inverted | P8 | 350-600 | 6.242 | 6.597 | -0.355 | 0.776 | 0.836 |
| Upright (Obj) | FCz | 300-600 | -2.185 | -2.342 | 0.157 | 0.776 | 0.836 |
| Upright (Obj) | Oz | 200-350 | 0.554 | 1.836 | -1.281 | 0.274 | 0.583 |
| Upright (Obj) | P7 | 200-350 | 2.002 | 2.879 | -0.877 | 0.316 | 0.583 |
| Upright (Obj) | P7 | 350-600 | 4.968 | 6.708 | -1.74 | 0.166 | 0.54 |
| Upright (Obj) | P8 | 200-350 | 2.626 | 3.6 | -0.974 | 0.305 | 0.583 |
| Upright (Obj) | P8 | 350-600 | 5.74 | 7.277 | -1.537 | 0.216 | 0.547 |
| Object | FCz | 300-600 | -1.335 | -2.302 | 0.968 | 0.09 | 0.36 |
| Object | Oz | 200-350 | -2.097 | -0.179 | -1.918 | 0.057 | 0.274 |
| Object | P7 | 200-350 | 0.607 | 2.357 | -1.75 | 0.016 | 0.128 |
| Object | P7 | 350-600 | 4.001 | 6.964 | -2.963 | 0.004 | 0.096 |
| Object | P8 | 200-350 | 1.532 | 1.866 | -0.334 | 0.692 | 0.836 |
| Object | P8 | 350-600 | 5.32 | 6.283 | -0.963 | 0.405 | 0.648 |
| Table 4. Differences between the artifact containing (n=100) and artifact-free (n = 100) files for the mean amplitude for each condition, ROI, and time window. | |||||||
Note: The FACE task has 2 blocks: one with upright and inverted faces and the other with upright faces and Sheinbug objects. The upright condition is separated into its corresponding block; “Upright (Inv)” are those upright faces during the inverted block while “Upright (Obj)” corresponds to upright faces during the object block. Differences between means are presented for each artifact designation, as well as the difference between them (delta). P-values were calculated for the differences between means, and then FDR corrected. Original and corrected p-values are presented.
| Contrast | ROI | Time Window (ms) | Mean Artifact | Mean No Artifact | Delta Δ | p Value | p value Adjusted (FDR) |
|---|---|---|---|---|---|---|---|
| Upright-Inverted | FCz | 300-600 | 0.21 | 0.22 | -0.01 | 0.99 | 0.992 |
| Upright-Object | FCz | 300-600 | 0.85 | 0.04 | 0.8 | 0.21 | 0.703 |
| Upright-Inverted | Oz | 200-350 | -0.61 | -1.1 | 0.49 | 0.64 | 0.703 |
| Upright-Object | Oz | 200-350 | -2.65 | -2.02 | -0.64 | 0.57 | 0.703 |
| Upright-Inverted | P7 | 200-350 | -0.23 | -1.92 | 1.69 | 0.05 | 0.703 |
| Upright-Inverted | P7 | 350-600 | 0.34 | -1.97 | 2.3 | 0.03 | 0.319 |
| Upright-Object | P7 | 200-350 | -1.4 | -0.52 | -0.87 | 0.38 | 0.319 |
| Upright-Object | P7 | 350-600 | -0.97 | 0.26 | -1.22 | 0.29 | 0.703 |
| Upright-Inverted | P8 | 200-350 | -0.8 | -1.25 | 0.46 | 0.61 | 0.703 |
| Upright-Inverted | P8 | 350-600 | -1.1 | -1.73 | 0.64 | 0.54 | 0.703 |
| Upright-Object | P8 | 200-350 | -1.09 | -1.73 | 0.64 | 0.5 | 0.703 |
| Upright-Object | P8 | 350-600 | -0.42 | -0.99 | 0.57 | 0.59 | 0.703 |
| Table 5. Differences between the artifact containing (n=100) and artifact-free (n = 100) files for the mean amplitude of the difference wave. | |||||||
Note: These are calculated for each Region of Interest (ROI) and timewindow. The upright conditions are from the corresponding block. Differences between means are presented for each artifact designation, as well as the difference between them (delta). P-values were calculated for the differences between means, and then FDR corrected. Original and corrected p-values are presented.