Page Last Updated: October 16, 2025
Quantitative MRI (qMRI)🔗
Release Data🔗
Note that different sites may apply varying criteria for identifying motion-degraded QALAS and B1⁺ mapping scans. For 3D-QALAS, the SyMRI toolbox does not incorporate externally acquired B1⁺ field maps when estimating quantitative T1, T2, and proton density (PD) values.
Additionally, estimated quantitative T1 values show variability across MRI vendors and participant age. Current estimates do not align well with values reported in the literature, likely due to assumptions made in the modeling procedures. Work is ongoing to address these issues. As a result, quantitative T1 values (and by extension, PD values) will not be included in the initial data release.
Quantitative MRI release data include file-based (raw and processed data files in modality-specific formats) data:
See the Data Structure Overview for a full explanation of these data types.
- Raw BIDS stored under subject- and session-specific
anat/folders - Derivatives generated by the SyMRI & qMRI Postproc pipelines
qMRI files are located under the anat/ directory along with anatomical MRI files, including QALAS and localizer files (acq-mrsLocAx and acq-mrsLocCor indicate axial and coronal localizers, respectively). See BIDS Conversion Procedures.
hbcd/
|__ rawdata/
    |__ sub-{ID}/
        |__ ses-{V0X}/
            |__ anat/
                |__ sub-{ID}_ses-{V0X}_acq-sub-<mrsLocAx|mrsLocCor>_run-{X}_T2w.nii.gz
                |__ sub-{ID}_ses-{V0X}_acq-sub-<mrsLocAx|mrsLocCor>_run-{X}_T2w.json
                |__ sub-{ID}_ses-{V0X}_run-{X}_inv-sub-<0|1|2|3|4>_QALAS.nii.gz
                |__ sub-{ID}_ses-{V0X}_run-{X}_inv-sub-<0|1|2|3|4>_QALAS.json
Quantitative MRI data was processed through two pipelines, SyMRI and qMRI PostProc. SyMRI, a proprietary software for quantitative MRI, is used to generate T1w and T2w images and derived relaxometry maps from QALAS brain images. These outputs are then minimally preprocessed by qMRI PostProc.
hbcd/
|__ derivatives/
    |__ symri/  # SyMRI Derivatives
    |   |__ sub-{ID}/
    |       |__ ses-{V0X}/
    |           |__ anat/
    |               |__ sub-{ID}_ses-{V0X}_acq-QALAS_T1w.nii.gz (+JSON)
    |               |__ sub-{ID}_ses-{V0X}_acq-QALAS_T2map.nii.gz (+JSON)
    |               |__ sub-{ID}_ses-{V0X}_acq-QALAS_T2w.nii.gz (+JSON)
    |               |__ sub-{ID}_ses-{V0X}_acq-QALAS_desc-SymriContainer.log
    |
    |__ qmri_postproc/ # qMRI Post-Proc Derivatives
        |__ sub-{ID}/
            |__ ses-{V0X}/
                |__ anat/
                    |__ sub-{ID}_ses-{V0X}_desc-AsegROIs_scalarstats.tsv (+JSON)
                    |__ sub-{ID}_ses-{V0X}_desc-BilateralAsegROIs_scalarstats.tsv (+JSON)
                    |__ sub-{ID}_ses-{V0X}_desc-RegistrationQCAid.png (+JSON)
                    |__ sub-{ID}_ses-{V0X}_space-QALAS_desc-aseg_dseg.nii.gz
                    |__ sub-{ID}_ses-{V0X}_space-T2w_desc-QALAS_T2map.nii.gz (+JSON)
Data Acquisition🔗
QALAS🔗
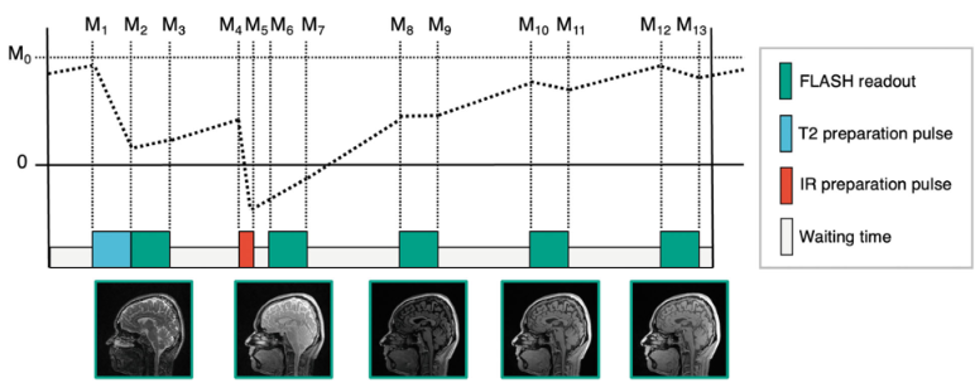
QALAS is a multi-contrast MRI sequence that produces five brain volumes using turbo-flash readouts with varying T1 and T2 weightings. These volumes are combined to estimate T1, T2, and proton density (PD) maps. The sequence starts with a T2-preparation pulse, which adds T2 weighting to the first volume. An inversion pulse follows, imparting T1 weighting to the next four volumes:
Figure 1. QALAS Pulse Sequence Diagram (Fujita et al., 2024)
Acquisition time: ~5 minutes (Siemens), ~4 minutes (GE/Philips).
B1+ Fieldmap🔗
The HBCD protocol also includes a short B1+ fieldmap acquisition (<1 minute) to calibrate flip angle measurements (which can vary spatially due to variations and inhomogeneities in the B1+ field) needed for accurate T1, T2, and PD estimation. Because the transmit B1+ field is spatially smooth and changes gradually, coarse resolutions are sufficient for these scans, allowing for fast acquisition times. The methods by vendor used for the HBCD protocol were:
- GE & Philips: Actual Flip Angle Imaging (AFI) (Yarnykh 2007)
- Siemens: Pre-saturation turbo-flash readout
Acquisition time: ~30–45 seconds across all scanner types (Siemens, GE, and Philips).
Data Processing🔗
See the folder tree above for a full list of SyMRI and qMRI PostProc derivatives included in the release.
Relaxation (T1/T2) & Proton Density (PD) Maps🔗
For the HBCD study, the MRI working group adopted 3D-QALAS (Kvernby et al. 2014), a time-efficient 3D method that combines interleaved Look-Locker acquisition with a T2-preparation pulse. This approach simultaneously estimates longitudinal (T1) and transverse (T2) relaxation times, as well as proton density (PD) maps, from a single scan, and has been validated across major MRI vendors (Fujita et al. 2019).
Conventional neuroimaging typically relies on qualitative relaxation time-weighted images, e.g, T1w and T2w images, which reflect relative differences in relaxation times, but are strongly influenced by sequence parameters, participant positioning, and scanner hardware. These dependencies complicate biological interpretation and hinder quantitative comparisons across participants, sessions, and sites. The issue is particularly acute in pediatric neuroimaging, where rapid changes in free water distribution, iron, and myelination alter image contrast as a function of age. By directly measuring relaxation properties, quantitative MRI overcomes many of these limitations and provides more reliable markers of brain tissue microstructure (Deoni 2010; Does 2018).
Synthetic T1w/T2w Images🔗
Using 3D-QALAS data with the Synthetic MRI (SyMRI) toolbox, we also generate synthetic T1w (Sy-T1w) and T2w (Sy-T2w) volumes. These are created by substituting quantitative estimates of T1 and T2 relaxation times back into the MR signal equation (Bloch equations) for each sequence. This enables flexible generation of different contrasts without acquiring separate scans.
References🔗
Dean III, D. C., Tisdall, M. D., Wisnowski, J. L., Feczko, E., Gagoski, B., Alexander, A. L., ... & HBCD MRI Working Group. (2024). Quantifying brain development in the HEALthy Brain and Child Development (HBCD) Study: The magnetic resonance imaging and spectroscopy protocol. Developmental Cognitive Neuroscience, 70, 101452. https://doi.org/10.1016/j.dcn.2024.101452
Deoni, S. C. L. (2010). Quantitative relaxometry of the brain. Topics in Magnetic Resonance Imaging: TMRI, 21(2), 101–113. https://doi.org/10.1097/RMR.0b013e31821e56d8
Deoni, S. C. L., Rutt, B. K., & Peters, T. M. (2006). Synthetic T1-weighted brain image generation with incorporated coil intensity correction using DESPOT1. Magnetic Resonance Imaging, 24(9), 1241–1248. https://doi.org/10.1016/j.mri.2006.03.015
Does, M. D. (2018). Inferring brain tissue composition and microstructure via MR relaxometry. NeuroImage, 182, 136–148. https://doi.org/10.1016/j.neuroimage.2017.12.087
Fautz H-P, Vogel M, Gross P, Kerr A, Zhu Y. B1 mapping of coil arrays for parallel transmission. Proceedings of the 16th Annual Meeting of ISMRM, Toronto, Canada. Vol. 1247. 2008.
Fujita, S., Gagoski, B., Hwang, K.-P., Hagiwara, A., Warntjes, M., Fukunaga, I., Uchida, W., Saito, Y., Sekine, T., Tachibana, R., Muroi, T., Akatsu, T., Kasahara, A., Sato, R., Ueyama, T., Andica, C., Kamagata, K., Amemiya, S., Takao, H., … Aoki, S. (2024). Cross-vendor multiparametric mapping of the human brain using 3D-QALAS: A multicenter and multivendor study. Magnetic Resonance in Medicine, 91(5), 1863–1875. https://doi.org/10.1002/mrm.29939
Fujita, S., Hagiwara, A., Hori, M., Warntjes, M., Kamagata, K., Fukunaga, I., Andica, C., Maekawa, T., Irie, R., Takemura, M. Y., Kumamaru, K. K., Wada, A., Suzuki, M., Ozaki, Y., Abe, O., & Aoki, S. (2019). Three-dimensional high-resolution simultaneous quantitative mapping of the whole brain with 3D-QALAS: An accuracy and repeatability study. Magnetic Resonance Imaging, 63, 235–243. https://doi.org/10.1016/j.mri.2019.08.031
Gonçalves, F. G., Serai, S. D., & Zuccoli, G. (2018). Synthetic brain MRI. Topics in Magnetic Resonance Imaging: TMRI, 27(6), 387–393. https://doi.org/10.1097/rmr.0000000000000189
Ji, S., Yang, D., Lee, J., Choi, S. H., Kim, H., & Kang, K. M. (2022). Synthetic MRI: Technologies and applications in neuroradiology. Journal of Magnetic Resonance Imaging, 55(4), 1013–1025. https://doi.org/10.1002/jmri.27440
Kvernby, S., Warntjes, M. J. B., Haraldsson, H., Carlhäll, C.-J., Engvall, J., & Ebbers, T. (2014). Simultaneous three-dimensional myocardial T1 and T2 mapping in one breath hold with 3D-QALAS. Journal of Cardiovascular Magnetic Resonance: Official Journal of the Society for Cardiovascular Magnetic Resonance, 16(1), 102. https://doi.org/10.1186/s12968-014-0102-0
Yarnykh, V. L. (2007). Actual flip-angle imaging in the pulsed steady state: a method for rapid three-dimensional mapping of the transmitted radiofrequency field. Magnetic Resonance in Medicine, 57(1), 192–200. https://doi.org/10.1002/mrm.21120