Page Last Updated: November 13, 2025
HBCD MR Quality Control Procedures🔗
Raw MR Data QC🔗
Raw MR QC includes automated and manual checks to evaluate unprocessed MRI data. Raw data QC is performed to detect acquisition errors, image artifacts, or corrupted files early so that problematic scans are excluded from the released raw BIDS dataset and downstream processing.
The session folder sub-{ID}_ses-{V0X}_scans.tsv files include the following QC metrics. Note: x values for bx below include 0, 500, 1000, 2000, and 3000
| Field | Description |
|---|---|
| filename | Relative paths to files |
| acq_time | Acquisition time |
| loris_qc_status | Pass/Fail mapping from UCSD QC JSON file |
| loris_selected | Whether file is selected for further processing |
| site | Site where the session data was collected |
| age | Age (in years) of participant at time of the scan |
| age_adjusted | Adjusted age (in days) based on the EDD |
| head_size | Head size at the time of the scan |
| nrev | Manual QC Metric Number of manual QC reviewers |
| revdisp | Manual QC Metric If there was disparity/disagreement between reviewers |
| QC | Manual QC Metric Overall manual QC score: 1 (pass), 0 (fail) Note: scans with only automated, and not manual, QC performed have a QC field value of 1 |
| notes | Manual QC Metric Optional notes from manual QC review |
| QU_motion | Manual QC Metric Qualitative manual QC score for motion (sMRI & qMRI) |
| QU_sus | Manual QC Metric Qualitative manual QC score for susceptibility artifact (dMRI, fMRI, & field maps) |
| QU_cutoff | Manual QC Metric Qualitative manual QC score for FOV cutoff artifact (dMRI, fMRI, & field maps) |
| QU_line | Manual QC Metric Qualitative manual QC score for line artifact (dMRI, fMRI, & field maps) |
| line_nframes | Number of frames with line artifacts |
| line_<max|mean>_score | Maximum/Mean line artifact score across frames |
| line_<max|mean>_count | Maximum/Mean line artifact count across frames |
| cutoff | Sum of dorsal and ventral cutoff scores |
| <dorsal|ventral>_cutoff | Dorsal/Ventral cutoff score |
| brain_<mean|std> | Mean/Standard deviation of image intensity within brain mask |
| brain_SNR | Signal-to-noise ratio (mean/stdev) of image intensity within brain mask |
| brain_<min|max|median> | Minimum/Maximum/Median image intensity within brain mask |
| brain_tSNR_<mean|median|std> | Mean/Median/Standard deviation of temporal SNR in brain mask |
| mean_<motion|trans|rot> | Average framewise displacement/translation/rotation (mm) |
| max_d<x|y|z> | Maximum absolute x/y/z translation (mm) |
| max_r<x|y|z> | Maximum absolute x/y/z rotation (mm) |
| subthresh_<02|03|04> | Number of seconds with framewise displacement less than 0.2/0.3/0.4 mm |
| aqc_motion | Automated QC motion score for sMRI |
| nreps | Number of repetitions / frames |
| brainvol | Volume of brain mask (mm^3) |
| fwhm_x | Full width half max spatial smoothness in x-axis (left-right) |
| b0_<median|std> | Median/Standard Deviation b=0 intensity in brain mask |
| DTerr_<mean|median|std> | Mean/Median/STD across frames of RMS residual error relative to RMS signal in brain voxels |
| Completed | Whether series has the expected number of files |
| NumberOfFiles | Number of DICOM files |
| HBCD_compliant | Whether series passes minimal protocol compliance check |
| AdditionalInfo | Notes on classification and protocol compliance |
| MD_std | Standard deviation of mean diffusivity in brain mask |
| b0_mean | Average b=0 intensity in brain mask |
| FA_std | Standard deviation of fractional anisotropy in brain mask |
| MD_<mean|median> | Mean/Median MD (mean diffusivity) in brain mask |
| max_nbad_frames_per_slice | Maximum number of outlier frames per slice |
| max_nbad_frames_per_frame | Maximum number of outlier frames per slice/frame |
| FA_<mean|median> | Mean/Median fractional anisotropy in brain mask |
| fwhm_z | Full width half max spatial smoothness in z-axis (inferior-superior) |
| nbad_frame_slices | Number of outlier frame-slices (dMRI) |
| nbad_frames | Number of frames with outlier slices (dMRI) |
| nbad_slices | Number of slices with outlier frames (dMRI) |
| fwhm_y | Full width half max spatial smoothness in y-axis (anterior-posterior) |
| qc_status | Whether review is pending, complete, or has other status |
| ngood_frames | Number of frames without outlier slices (dMRI) |
| censor_thresh | Threshold used for censoring outlier slices (dMRI) |
| nframes_bx | Number of b=x frames |
| nbad_frame_slices_bx | Number of outlier frame-slices for dMRI b=x frames |
| nbad_frames_bx | Number of frames with outlier slices for dMRI b=x frames |
| nbad_slices_bx | Number of slices with outlier frames for dMRI b=x frames |
| ngood_frames_bx | Number of frames without outlier slices for dMRI b=x frames |
| FWHMx_bx | FWHM spatial smoothness in x-axis (left-right) for b=x frames |
| FWHMy_bx | FWHM spatial smoothness in y-axis (anterior-posterior) for b=x frames |
| FWHMz_bx | FWHM spatial smoothness in z-axis (inferior-superior) for b=x frames |
| tSNR_bx | Median temporal SNR in brain mask for for b=x frames |
| DTerr_rel_bx | Median DTI RMS residual error for b=x frames across voxels relative to within-voxel RMS b=0 signal |
| RSIerr_rel_bx | Median RSI RMS residual error for b=x frames across voxels relative to within-voxel RMS b=0 signal |
| DTerr_rel | Median of DTI RMS residual error for all frames across voxels relative to within-voxel RMS signal |
| RSIerr_rel | Median RSI RMS residual error for all frames across voxels relative to within-voxel RMS signal |
| NumberOfFilesMissing | Number of DICOM files apparently missing (based on gaps in InstanceNumbers) |
| Num<Head|Neck|Spine>CoilElem | Number of head/neck/spine coil elements |
| brain_nvox_max | Number of voxels within brain mask at maximum image intensity |
| brain_fvox_max | Fraction of voxels within brain mask at maximum image intensity |
| nonbrain_<mean|std|snr> | Mean/Standard deviation/Signal-to-noise ratio (mean/stdev) image intensity outside brain mask |
| NumberOfFilesOrig | Number of DICOM files received (before excluding non-image, corrupt, or extra files) |
| NumberOfFilesExtra | Number of extra DICOM files received (non-image, corrupt, or extra files) |
Automated QC🔗
Automated QC is performed at the HBCD Data Coordinating Center (HDCC) immediately after data upload. Following protocol compliance and completeness checks, the following automated QC metrics available in the release are calculated:
| Modality | QC Procedures |
|---|---|
| sMRI & qMRI | • Estimate motion artifacts using a deep learning model • Compute signal-to-noise ratio (SNR) |
| fMRI |
• Estimate head motion with average FDframewise displacement and data (sec) at FD thresholds of 0.2/0.3/0.4 mm (Power et al., 2012) • Detect line artifacts and FOV cutoff • Compute spatial smoothness (FWHM) and temporal SNR (tSNR) after motion correction (Triantafyllou et al., 2005) |
| dMRI |
• Estimate head motion (framewise displacement, FD) • Refine motion estimates via registration to tensor-synthesized images (Hagler et al., 2009) • Identify dark slices (caused by abrupt head movements) using RMS difference between raw and tensor-fitted data • Calculate total slices and frames with motion artifacts • Detect line artifacts and field-of-view (FOV) cutoff |
| Field Maps | Detect line artifacts and field-of-view (FOV) cutoff |
| All | Compute SNR where applicable |
Protocol Compliance
- Extract imaging parameters from DICOM headers
- Confirm key parameters (e.g., voxel size, TR, orientation) match the expected protocol for each scanner
- Flag out-of-compliance series for review; sites are contacted if corrective action is needed
Completeness Checks
Completeness checks verify that all expected series are present in each imaging session. For example, dMRI and fMRI require paired EPI field maps for distortion correction. Missing data usually indicate an aborted scan or incomplete data transfer (often resolved by re-sending files). Series included in a valid session include the following:
| Modality | Required Series |
|---|---|
| Structural MRI (sMRI) | T1w & T2w |
| Functional MRI (fMRI) | Resting state (rs) runs 1 & 2, each accompanied by fieldmaps acquired in AP and PA phase encoding directions |
| Diffusion MRI (dMRI) | Diffusion scans acquired in AP and PA phase encoding directions |
| Quantitative MRI (qMRI) | 3DMagic/QALAS and B1 Map |
| MR Spectroscopy (MRS) | MRS scan and SVS localizer |
Manual Review🔗
Automated metrics flag series for manual review using multivariate prediction and Bayesian classifiers. Trained technicians then score artifact severity on a 0–3 scale (0 = none, 1 = mild, 2 = moderate, 3 = severe). Series with severe artifacts (score = 3) are rejected (QC = 0) and excluded from processing. Data are selected from the remaining series based on manual ratings, notes, and automated scores.
| Modality | QC Procedures & Scoring |
|---|---|
| sMRI | • Motion artifacts (ripples, blurring), scored 0–3 • Document additional issues (e.g., intensity inhomogeneity, ghostingfaint displaced copy of anatomy due to slices outside FOV) |
| qMRI | • Same artifact scoring (0–3) • Inspect derived data (parametric maps, ROI analysis, quantitative checks for 3D-QALAS) |
| dMRI & fMRI, & field maps |
• Score susceptibility artifacts, FOV cutoff, and horizontal line artifacts (present in the sagittal view) • Note susceptibility artifacts, including signal dropoutcommon in posterior occipital cortex of infant fMRI data acquired in PA phase encoding direction, signal bunching, and warping |
| MRS | Visual inspection and overall QC only of SVS localizer (used to define spectroscopy ROI) |
BrainSwipes🔗
Manual visual inspection remains the gold standard for detecting artifacts in structural, functional (e.g., XCP-D), and diffusion (e.g., QSIPrep) derivatives. To support this, derivative visual reports are integrated into BrainSwipes, a gamified, crowdsourced QC platform built on the open-source Swipes For Science framework. BrainSwipes provides an intuitive interface for large-scale studies, guiding users through a short tutorial before they evaluate images and classify them as pass or fail.
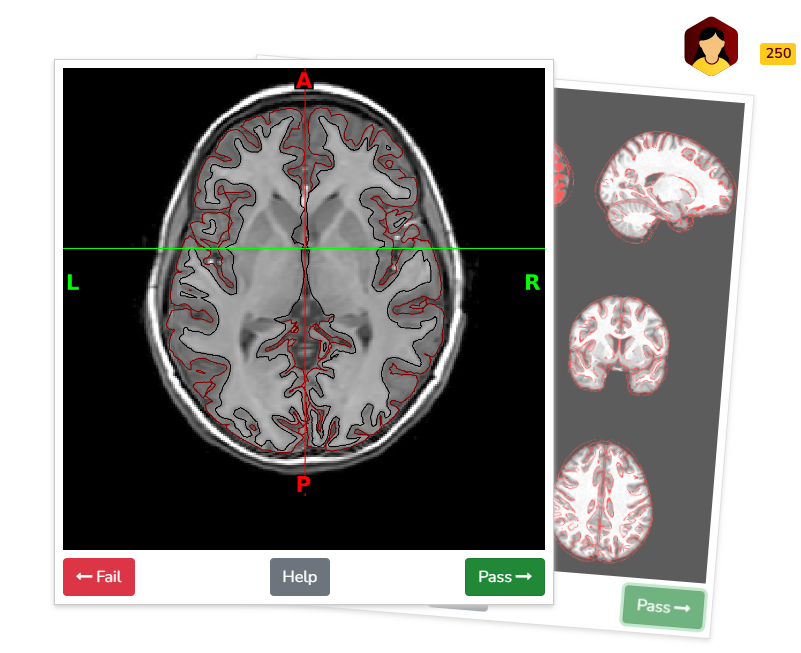
Example quality assessment of surface delineation on BrainSwipes platform (displaying brain in axial plane at level of basal ganglia/putamen).
Surface Delineation:
For structural QA, swipers are presented with image slices in coronal, axial, and sagittal planes to assess the accuracy of T1w and T2w surface delineations in differentiating gray and white matter. Images are derived from XCP-D visual reports.Atlas Registration:
In addition to surface delineation, structural QA also includes atlas registration quality, evaluated by overlaying delineations of the subject’s image onto the atlas, and vice versa. Swipes display nine T1w slices for visual inspection, with three slices per anatomical plane. Quality is assessed based on the alignment of the outer boundaries of the overlaid contours with those of the underlying image, ensuring minimal gaps or misalignments. Images are derived from XCP-D visual reports.
Functional Registration:
Functional registration is evaluated by overlaying outlines of functional images onto structural images and vice versa. Swipes display nine slices of the same functional image for visual inspection, with three slices per anatomical plane. Quality is assessed similarly to structural atlas registration, focusing on the alignment of the overlaid contours. Additional evaluation includes checking for artifacts such as signal dropout. Images are derived from XCP-D visual reports.Diffusion Direction Encoding (to be included in future release):
Swipes display GIFs of full-resolution T2w images as a grayscale background, with the "Direction Encoded Color" (DEC) map overlaid. These GIFs sweep through a portion of the brain across the three anatomical planes. High-quality processed DWI images exhibit bands of color that closely follow the folds and contours of the grayscale background. These visuals are derived from the QSIPrep report.Each visual report for a given modality is independently reviewed and rated as a pass or fail, which in the outputs are scored as values of 1 and 0 respectively. BrainSwipes generates a summary of these results that includes the average score as well as number of reviewers for each visual report of each modality.
BrainSwipes QC results are provided as tabulated data: img_brainswipes_xcpd-T2w and img_brainswipes_xcpd-bold. QC scores range from 0 (Fail) to 1 (Pass), averaged across reviewers. For example, a score of 0.6 indicates that 60% of reviewers rated the image as a pass. The data includes overall average QC scores and average number of reviewers for each session-level T2w and BOLD run (summarizing across all visual reports for a given run) as well as the average QC and number of reviewers for each visual report. A Python helper function is provided below to load a BrainSwipes TSV file into a Pandas DataFrame and filter runs with average QC scores above a user-specified threshold:
import pandas as pd

def read_and_filter_tsv(file_path, threshold):
    """
    Reads an HBCD BrainSwipes TSV file into a DataFrame and keeps subject rows where
    the overall average QC value is greater than or equal to the specified threshold.

    Parameters:
    - file_path (str): Path to the .tsv file
    - threshold (float): Threshold value for filtering

    Returns:
    - pd.DataFrame: Filtered DataFrame
    """
    df = pd.read_csv(file_path, sep='\t')

    fourth_col = df.columns[3]
    return df[df[fourth_col] >= threshold]

# Example usage:
# Filter to keep only subjects with an average structural QC of at least 0.6 (60% pass rate)
filtered_df = read_and_filter_tsv("img_brainswipes_xcpd_T2w.tsv", 0.6)
print(filtered_df.head())
References🔗
Dean III, D. C., Tisdall, M. D., Wisnowski, J. L., Feczko, E., Gagoski, B., Alexander, A. L., ... & HBCD MRI Working Group. (2024). Quantifying brain development in the HEALthy Brain and Child Development (HBCD) Study: The magnetic resonance imaging and spectroscopy protocol. Developmental Cognitive Neuroscience, 70, 101452. https://doi.org/10.1016/j.dcn.2024.101452
Gard, A. M., Hyde, L. W., Heeringa, S. G., West, B. T., & Mitchell, C. (2023). Why weight? Analytic approaches for large-scale population neuroscience data. Developmental Cognitive Neuroscience, 59, 101196. https://doi.org/10.1016/j.dcn.2023.101196
Hagler, D. J., Jr, Ahmadi, M. E., Kuperman, J., Holland, D., McDonald, C. R., Halgren, E., & Dale, A. M. (2009). Automated white-matter tractography using a probabilistic diffusion tensor atlas: Application to temporal lobe epilepsy. Human Brain Mapping, 30(5), 1535–1547. https://doi.org/10.1002/hbm.20619
Power, J. D., Barnes, K. A., Snyder, A. Z., Schlaggar, B. L., & Petersen, S. E. (2012). Spurious but systematic correlations in functional connectivity MRI networks arise from subject motion. NeuroImage, 59(3), 2142–2154. https://doi.org/10.1016/j.neuroimage.2011.10.018
Triantafyllou, C., Hoge, R. D., Krueger, G., Wiggins, C. J., Potthast, A., Wiggins, G. C., & Wald, L. L. (2005). Comparison of physiological noise at 1.5 T, 3 T and 7 T and optimization of fMRI acquisition parameters. NeuroImage, 26(1), 243–250. https://doi.org/10.1016/j.neuroimage.2005.01.007