Page Last Updated: October 10, 2025
Functional MRI (fMRI)🔗
Release Data🔗
Head motion is a serious issue for neuroimaging, and especially for resting state fMRI. It creates brain-wide artifactual effects including elevated short-distance connectivity and attenuated long-distance connectivity (Power et al. 2012). In order to guard against artifactual effects due to head motion, researchers typically implement a variety of strategies that operate at multiple points of the data collection and processing pipeline, with guidance regularly evolving over time (Power et al. 2014; 2015; Satterthwaite et al. 2013; Siegel et al. 2017; Gratton et al. 2020). Some of these strategies include discarding entire runs of data that exceed certain motion thresholds and discarding individual functional imaging frames that are proximal to motion events (i.e., “motion censoring”). These strategies in particular typically lead to the exclusion of some participants from further analysis for lack of sufficient data.
Levels of head motion differ according to demographic factors such as sex, race/ethnicity, and SES (Cosgrove et al., 2022). Therefore, strategies to deal with head motion may introduce questions of fairness and may lead to differential exclusions across demographic groups. In addition, motion censoring causes sessions to vary by the amount of data remaining. Such variability may continue to inflate findings especially in the presence of conditions that may correlate with the motion artifact like autism or ADHD (Eggebrecht, 2017). The amount of data remaining influences the variation in the connectivity calculations by affecting the degrees of freedom. Therefore, even after motion censoring, issues concerning fairness may persist when examining factors that might be affected by motion like sex, race/ethnicity, SES, and BMI (Cosgrove et al., 2022). One strategy that avoids this confound is to strictly control the degrees of freedom, where functional connectivity measures are calculated with the exact same amount of data. Researchers should assess whether control of artifactual effects of head motion effects can be achieved by alternative means that mitigate this impact. Examples of such strategies could include data augmentation approaches such as sampling from other datasets, data processing strategies like the include use of ICA-based denoising (Pruim et al., 2015a; 2015b), use of bootstrap aggregation (Ramduny et al., 2024), or the creation of “pseudo-rest” by removing task signals from the task data (Fair et al. 2007), or post-hoc approaches like propensity weighting.
Researchers interested in examining brain-behavior associations or multivariate predictions should follow strategies such as those in Eggebrecht 2017 to: 1) assess how missing data impacts dependent, independent variables and covariates, 2) examine the association between the degrees of freedom and non-FC variables, 3) use trimmed FC measures when needed to mitigate artifacts due to data quality.
Philips signal intensity clipping - Overview
A subset of Philips fMRI scans is affected by a signal intensity clipping issue. Due to a scaling error during real-time reconstruction, raw pixel intensity values above 4095 are capped, resulting in hyperintense regions that obscure gray/white matter signal. This artifact can significantly impact BOLD registration and derived measures such as ROI-to-ROI correlations.
Detection and Prevalence
The artifact was initially detected during HBCD pilot scanning through manual quality control (QC) and addressed with a protocol patch applied at most Philips sites prior to the start of the HBCD main study. However, the patch was implemented later (October 2024) at sites VAN and CCH, leading to residual cases at these locations. Severe cases typically fail manual QC (QC=0), while less severe cases often pass (QC=1), as they may not be visually apparent. Overall, ~20% of scans from VAN and CCH show some degree of clipping, with ~6% classified as severe enough to fail QC. Updates to real-time reconstruction are in development to recover affected data. In the meantime, only scans that pass QC, including those with mild clipping, are included in the release.
How to Identify Affected Scans
Clipping severity can be estimated using the ratio of median to maximum image intensity and the fraction of voxels at maximum intensity within the brain mask (both available in the scans.tsv file):
- Severe clipping: (brain_median / brain_max) > 0.8 AND brain_fvox_max > 0.001
- Potential clipping: (brain_median / brain_max) > 0.5 AND brain_fvox_max > 0.001
Functional MRI release data include both file-based (raw and processed data files in modality-specific formats) and tabulated (instrument and derived data in a standardized table format) data.
See the Data Structure Overview for a full explanation of these data types.
- Raw BIDS stored under subject- and session-specific
func/andfmap/folders - Processed derivatives generated by various pipelines
- Tabulated data derived from pipeline outputs — see the full list of tables here
BOLD functional resting state data are located under func/. Each BOLD run has an associated pair of EPI fieldmaps acquired for distortion correction under fmap/ in AP and PA (dir-<AP|PA>) phase encoding directions. Siemens, GE, and Philips additionally include B1 fieldmaps - see qMRI BIDS specifications for details. See BIDS Conversion Procedures.
hbcd/
|__ rawdata/
    |__ sub-{ID}/
        |__ ses-{V0X}/ # All files are accompanied by sidecar JSONs
            |__ func/
            |   |__ sub-{ID}_ses-{V0X}_task-rest_dir-PA_run-{X}_bold.nii.gz
            |
            |__ fmap/
                |__ sub-{ID}_ses-{V0X}_dir-<AP|PA>_run-{X}_epi.nii.gz
                |__ sub-{ID}_ses-{V0X}_acq-<anat|fmap>_run-{X}_TB1TFL.nii.gz # B1 fmap (Siemens only)
                |__ sub-{ID}_ses-{V0X}_acq-<tr1|tr2>_run-{X}_TB1AFI.nii.gz   # B1 fmap (GE & Philips only)
MRIQC extracts image quality metrics (IQMs) from functional MRI data and also generates visual .html reports.
Go to pipeline documentation
hbcd/
|__ derivatives/
    |__ mriqc/
        |__ sub-{ID}/
        |   |__ ses-{V0X}/
        |       |__ func/
        |           |__ sub-{ID}_ses-{V0X}_task-rest_dir-PA_run-{X}_bold.json
        |
        |__ sub-{ID}_ses-{V0X}_task-rest_dir-PA_run-{X}_bold.html
Infant-fMRIPrep (also known as NiBabies) outputs from minimal structural and functional MRI processing include visual quality assessment reports, preprocessed derivatives, and confounds to be used for denoising in subsequent processing procedures.
Go to pipeline documentation
hbcd/
|_ derivatives/
   |_ nibabies/
      |_ sub-{ID}/
      |  |_ figures/
      |  |_ ses-{V0X}/
      |     |_ log/
      |     |
      |     |_ anat/
      |     |  |_ sub-{ID}_ses-{V0X}_run-{X}_desc-preproc_T2w.nii.gz (+JSON)
      |     |  |_ sub-{ID}_ses-{V0X}_run-{X}_from-<MNI152NLin6Asym_res-2|MNIInfant+1>_to-T2w_mode-image_xfm.h5
      |     |  |_ sub-{ID}_ses-{V0X}_run-{X}_from-T2w_to-<MNI152NLin6Asym_res-2|MNIInfant+1>_mode-image_xfm.h5
      |     |  |_ sub-{ID}_ses-{V0X}_run-{X}_from-T2w_to-fsnative_mode-image_xfm.txt
      |     |  |_ sub-{ID}_ses-{V0X}_run-{X}_from-fsnative_to-T2w_mode-image_xfm.txt
      |     |  |_ sub-{ID}_ses-{V0X}_run-{X}_hemi-<L|R>_<curv|sulc|thickness>.shape.gii
      |     |  |_ sub-{ID}_ses-{V0X}_run-{X}_hemi-<L|R>_<inflated|midthickness|pial|sphere|white>.surf.gii
      |     |  |_ sub-{ID}_ses-{V0X}_run-{X}_hemi-<L|R>_space-dhcpAsym_den-32k_midthickness.surf.gii
      |     |  |_ sub-{ID}_ses-{V0X}_run-{X}_hemi-<L|R>_space-dhcpAsym_den-32k_pial.surf.gii
      |     |  |_ sub-{ID}_ses-{V0X}_run-{X}_hemi-<L|R>_space-dhcpAsym_den-32k_white.surf.gii
      |     |  |_ sub-{ID}_ses-{V0X}_run-{X}_hemi-<L|R>_space-<dhcpAsym|fsaverage>_den-32k_sphere.surf.gii
      |     |  |_ sub-{ID}_ses-{V0X}_run-{X}_space-MNI152NLin6Asym_res-2_desc-brain_mask.nii.gz (+JSON)
      |     |  |_ sub-{ID}_ses-{V0X}_run-{X}_space-MNI152NLin6Asym_res-2_desc-preproc_T2w.nii.gz (+JSON)
      |     |  |_ sub-{ID}_ses-{V0X}_run-{X}_space-MNI152NLin6Asym_res-2_dseg.nii.gz (+JSON)
      |     |  |_ sub-{ID}_ses-{V0X}_run-{X}_space-<MNI152NLin6Asym_res-2|T2w>_label-<CSF|GM|WM>_probseg.nii.gz
      |     |  |_ sub-{ID}_ses-{V0X}_run-{X}_space-T2w_desc-<aparcaseg|aseg>_dseg.nii.gz
      |     |  |_ sub-{ID}_ses-{V0X}_run-{X}_space-T2w_dseg.nii.gz
      |     |  |_ sub-{ID}_ses-{V0X}_run-{X}_space-T2w_desc-ribbon_mask.nii.gz (+JSON)
      |     |  |_ sub-{ID}_ses-{V0X}_run-{X}_space-fsLR_den-91k_<curv|sulc|thickness>.dscalar.nii (+JSON)
      |     |
      |     |_ fmap/
      |     |  |_ sub-{ID}_ses-{V0X}_run-{X}_fmapid-auto00000{X}_desc-coeff_fieldmap.nii.gz
      |     |  |_ sub-{ID}_ses-{V0X}_run-{X}_fmapid-auto00000{X}_desc-epi_fieldmap.nii.gz
      |     |  |_ sub-{ID}_ses-{V0X}_run-{X}_fmapid-auto00000{X}_desc-preproc_fieldmap.nii.gz (+JSON)
      |     |
      |     |_ func/ (ALL +JSON)
      |        |_ sub-{ID}_ses-{V0X}-task-rest_dir-PA_run-{X}_desc-brain_mask.nii.gz
      |        |_ sub-{ID}_ses-{V0X}-task-rest_dir-PA_run-{X}_desc-confounds_timeseries.tsv
      |        |_ sub-{ID}_ses-{V0X}-task-rest_dir-PA_run-{X}_desc-coreg_boldref.nii.gz
      |        |_ sub-{ID}_ses-{V0X}-task-rest_dir-PA_run-{X}_desc-hmc_boldref.nii.gz
      |        |_ sub-{ID}_ses-{V0X}-task-rest_dir-PA_run-{X}_desc-preproc_bold.nii.gz
      |        |_ sub-{ID}_ses-{V0X}-task-rest_dir-PA_run-{X}_from-boldref_to-T2w_mode-image_desc-coreg_xfm.txt
      |        |_ sub-{ID}_ses-{V0X}-task-rest_dir-PA_run-{X}_from-boldref_to-auto00000_mode-image_xfm.txt
      |        |_ sub-{ID}_ses-{V0X}-task-rest_dir-PA_run-{X}_from-orig_to-boldref_mode-image_desc-hmc_xfm.txt
      |        |_ sub-{ID}_ses-{V0X}-task-rest_dir-PA_run-{X}_hemi-<L|R>_space-fsnative_bold.func.gii
      |        |_ sub-{ID}_ses-{V0X}-task-rest_dir-PA_run-{X}_space-MNI152NLin6Asym_res-2_boldref.nii.gz
      |        |_ sub-{ID}_ses-{V0X}-task-rest_dir-PA_run-{X}_space-MNI152NLin6Asym_res-2_desc-brain_mask.nii.gz
      |        |_ sub-{ID}_ses-{V0X}-task-rest_dir-PA_run-{X}_space-MNI152NLin6Asym_res-2_desc-preproc_bold.nii.gz
      |        |_ sub-{ID}_ses-{V0X}-task-rest_dir-PA_run-{X}_space-T2w_boldref.nii.gz
      |        |_ sub-{ID}_ses-{V0X}-task-rest_dir-PA_run-{X}_space-T2w_desc-brain_mask.nii.gz
      |        |_ sub-{ID}_ses-{V0X}-task-rest_dir-PA_run-{X}_space-T2w_desc-preproc_bold.nii.gz
      |        |_ sub-{ID}_ses-{V0X}-task-rest_dir-PA_run-{X}_space-fsLR_den-91k_bold.dtseries.nii
      |
      |__ sub-{ID}_ses-{V0X}.html
The mcribs/ and freesurfer/ derivatives folders are sourced from intermediate FreeSurfer-like folders generated by Infant-fMRIPrep during surface reconstruction - see details. Infant fMRIPrep supports three surface reconstruction methods, each optimized for a specific age range (see Goncalves et al., 2025 for details):
| Surface Reconstruction Method | Optimal Age Range | Description |
|---|---|---|
| M-CRIB-S | ≤ 5 months | Neonate method based on the Melbourne Children’s Regional Infant Brain atlases (Adamson et al. 2020) |
| Infant FreeSurfer | ≥ 3 months | Modified version of FreeSurfer optimized for infants 0–2 years (Zöllei et al. 2020) |
| FreeSurfer | ≥ 10 months | Standard FreeSurfer, developed from adult data (Dale et al. 1998) |
The current HBCD release includes Infant-fMRIPrep derivatives for visit V02 (0–1 months) using M-CRIB-S for surface reconstruction. When M-CRIB-S is used, the freesurfer/ folder is generated by mapping outputs from mcribs/ to follow the structure of FreeSurfer’s recon-all for compatibility. As a result, files in freesurfer/ are identical to the corresponding source files in mcribs/, the only differences being:
• M-CRIB-S FS: contains 2 symlink in place of regular files
• Derivatives FS: includes 3 additional files, scripts/mcribs.log and surf/<l|r>h.midthickness
hbcd/
|__ derivatives/
    |__ freesurfer/
    |   |__ sub-{ID}_ses-{V0X}/
    |       |__ label/
    |       |   |__ <lh|rh>.aparc+DKTatlas.annot
    |       |   |__ <lh|rh>.aparc+DKTatlas.auto.nomask.annot
    |       |   |__ <lh|rh>.aparc.annot
    |       |   |__ <lh|rh>.aparc.auto.nomask.annot
    |       |   |__ <lh|rh>.cortex.label
    |       |
    |       |__ mri/
    |       |   |__ T2.mgz
    |       |   |__ aparc+<DKTatlas>+aseg.mgz
    |       |   |__ aseg.mgz
    |       |   |__ aseg.<internal|presurf|presurf.preunwmfix>.mgz
    |       |   |__ brain.mgz
    |       |   |__ brainmask.mgz
    |       |   |__ <lh|rh>.ribbon.mgz
    |       |   |__ norm.mgz
    |       |   |__ orig.mgz
    |       |   |__ ribbon.mgz
    |       |
    |       |__ scripts/
    |       |   |__ mcribs.log
    |       |
    |       |__ stats/
    |       |   |__aseg.stats
    |       |   |__brainvol.stats
    |       |   |__ <lh|rh>.aparc+DKTatlas.stats
    |       |   |__ <lh|rh>.aparc.stats
    |       |   |__ <lh|rh>.curv.stats
    |       |
    |       |__ surf/
    |           |__ <lh|rh>.<area|area.mid|area.pial>
    |           |__ <lh|rh>.curv
    |           |__ <lh|rh>.inflated
    |           |__ <lh|rh>.inflated.<H|K>
    |           |__ <lh|rh>.midthickness
    |           |__ <lh|rh>.orig
    |           |__ <lh|rh>.pial
    |           |__ <lh|rh>.smoothwm
    |           |__ <lh|rh>.smoothwm.<BE|C|FI|H|K|K1|K2|S>.crv
    |           |__ <lh|rh>.smoothwm.<H|K>
    |           |__ <lh|rh>.sphere
    |           |__ <lh|rh>.sphere.<reg|reg2>
    |           |__ <lh|rh>.<sulc|thickness|volume|white>
    |
    |__ mcribs/
        |__ sub-{ID}_ses-{V0X}/
            |__ RawT2/
            |   |__ sub-{ID}_ses-{V0X}.nii.gz
            |
            |__ RawT2RadiologicalIsotropic/
            |   |__ sub-{ID}_ses-{V0X}.nii.gz_symlink_s3_object
            |
            |__ SurfReconDeformable/
            |   |__ sub-{ID}_ses-{V0X}/
            |       |__ meshes/
            |       |   |__ <internal|pial+internal|pial|white+internal|white>.vtp
            |       |   |__ pial-<lh|rh>-reordered.vtp
            |       |   |__ pial-<lh|rh>.vtp
            |       |   |__ white-<lh|rh>.CortexMask.curv
            |       |   |__ white-<lh|rh>.Normals.surf
            |       |   |__ white-<lh|rh>.RegionId.curv
            |       |   |__ white-<lh|rh>.vtp
            |       |
            |       |__ recon/
            |       |   |__ cortical-hull-dmap.nii.gz
            |       |   |__ regions.nii.gz
            |       |
            |       |__ temp/
            |           |__ <brain|cortex>-mask.nii.gz
            |           |__ cerebrum-<1|2|3>.vtp
            |           |__ cerebrum-<lh|rh>-<1|2|3>.vtp
            |           |__ cerebrum-<lh|rh>-2-output_#.vtp
            |           |__ cerebrum-<lh|rh>-dmap.nii.gz
            |           |__ cerebrum-<lh|rh>-hull-#.vtp
            |           |__ cerebrum-<lh|rh>-iso.vtp
            |           |__ cerebrum-<lh|rh>-mask.nii.gz
            |           |__ corpus-callosum-mask-<1|2|3>.nii.gz
            |           |__ deep-gray-matter-mask-<1|2>.nii.gz
            |           |__ gray-matter-mask-<1|2>.nii.gz
            |           |__ pial-<#|#-output_#>.vtp
            |           |__ pial-foreground.nii.gz
            |           |__ t2w-image.nii.gz_symlink_s3_object
            |           |__ ventricles-dmap.nii.gz
            |           |__ ventricles-mask-<1|2>.nii.gz
            |           |__ white-<#|#-output_#>.vtp
            |           |__ white-foreground.nii.gz
            |           |__ white-matter-mask-<1|2>.nii.gz
            |
            |__ TissueSeg/
            |   |__ sub-{ID}_ses-{V0X}_all_labels.nii.gz
            |   |__ sub-{ID}_ses-{V0X}_all_labels_manedit.nii.gz_symlink_s3_object
            |   |__ sub-{ID}_ses-{V0X}_brain_mask.nii.gz
            |   |__ sub-{ID}_ses-{V0X}_t2w_restore.nii.gz_symlink_s3_object
            |
            |__ TissueSegDrawEM/
            |   |__ sub-{ID}_ses-{V0X}/
            |       |__ N4/
            |           |__ sub-{ID}_ses-{V0X}.nii.gz_symlink_s3_object
            |
            |__ freesurfer/ # Only files unique to M-CRIB-S FreeSurfer subfolder displayed
            |   |__ sub-{ID}_ses-{V0X}/
            |       |__ label/
            |       |__ mri/
            |       |   |__ brain.mgz_symlink_s3_object
            |       |   |__ orig.mgz_symlink_s3_object
            |       |__ stats/
            |       |__ surf/
            |
            |__ logs/
            |   |__ sub-{ID}_ses-{V0X}.log
            |
            |__ command.txt
The M-CRIB-S folders contain four symlink files, which serve as references to data stored elsewhere. When these files are uploaded to the release bucket, they are renamed with the suffix *_symlink_s3_object to distinguish them from regular files. When downloaded, these symlink files appear as text files because they contain the S3 object path instead of the actual file content. To restore them as symlinks, run one of the following commands in the terminal:
Option 1: This command simply prints what commands to run to restore individual symlinks and does not change anything:
Option 2: This restores all symlink files within the directory and renames them without *_symlink_s3_object to match the original sourcedata filenames:
XCP-D performs functional MRI post-processing and noise regression from Infant-fMRIPrep derivatives. See the XCP-D documentation on "HBCD mode" functional outputs.
Go to pipeline documentation
hbcd/
|_ derivatives/
   |_ xcp_d/
      |_ sub-{ID}/
         |_ ses-{V0X}/
         |  |_ anat/
         |  |  |_ sub-{ID}_ses-{V0X}_run-{X}_space-MNI152NLin6Asym_desc-preproc_T2w.nii.gz
         |  |  |_ sub-{ID}_ses-{V0X}_run-{X}_space-fsLR_seg-<APARC>_stat-mean_desc-<curv|sulc|thickness>_morph.tsv
         |  |  |_ sub-{ID}_ses-{V0X}_run-{X}_hemi-<L|R>_space-fsLR_den-32k_<inflated|vinflated>.surf.gii
         |  |  |_ sub-{ID}_ses-{V0X}_run-{X}_hemi-<L|R>_space-fsLR_den-32k_<midthickness|pial|white>.surf.gii
         |  |  |_ sub-{ID}_ses-{V0X}_run-{X}_space-fsLR_den-91k_<curv|sulc|thickness>.dscalar.nii
         |  |
         |  |_ func/ # All func files have JSONs with exception of .hdf5 & *linc_qc.tsv
         |     |_ sub-{ID}_ses-{V0X}_task-rest_desc-abcc_qc.hdf5 (No JSON)
         |     |_ sub-{ID}_ses-{V0X}_task-rest_<motion|outliers>.tsv
         |     |_ sub-{ID}_ses-{V0X}_task-rest_space-fsLR_den-91k_desc-denoisedSmoothed_bold.dtseries.nii
         |     |_ sub-{ID}_ses-{V0X}_task-rest_space-fsLR_den-91k_desc-denoised_bold.dtseries.nii
         |     |_ sub-{ID}_ses-{V0X}_task-rest_space-fsLR_seg-<PARC>_den-91k_stat-mean_timeseries.ptseries.nii
         |     |_ sub-{ID}_ses-{V0X}_task-rest_space-fsLR_seg-<PARC>_stat-mean_timeseries.tsv
         |     |_ sub-{ID}_ses-{V0X}_task-rest_space-fsLR_seg-<PARC>_stat-pearsoncorrelation_relmat.tsv
         |     |_ sub-{ID}_ses-{V0X}-task-rest_dir-PA_run-{X}_desc-abcc_qc.hdf5 (No JSON)
         |     |_ sub-{ID}_ses-{V0X}-task-rest_dir-PA_run-{X}_space-fsLR_den-91k_desc-linc_qc.tsv (No JSON)
         |     |_ sub-{ID}_ses-{V0X}-task-rest_dir-PA_run-{X}_<design|motion|outliers>.tsv
         |     |_ sub-{ID}_ses-{V0X}-task-rest_dir-PA_run-{X}_space-fsLR_den-91k_desc-denoisedSmoothed_bold.dtseries.nii
         |     |_ sub-{ID}_ses-{V0X}-task-rest_dir-PA_run-{X}_space-fsLR_den-91k_desc-denoised_bold.dtseries.nii
         |     |_ sub-{ID}_ses-{V0X}-task-rest_dir-PA_run-{X}_space-fsLR_den-91k_stat-alff_boldmap.dscalar.nii
         |     |_ sub-{ID}_ses-{V0X}-task-rest_dir-PA_run-{X}_space-fsLR_den-91k_stat-alff_desc-smooth_boldmap.dscalar.nii
         |     |_ sub-{ID}_ses-{V0X}-task-rest_dir-PA_run-{X}_space-fsLR_den-91k_stat-reho_boldmap.dscalar.nii
         |     |_ sub-{ID}_ses-{V0X}-task-rest_dir-PA_run-{X}_space-fsLR_seg-<PARC>_den-91k_stat-coverage_boldmap.pscalar.nii
         |     |_ sub-{ID}_ses-{V0X}-task-rest_dir-PA_run-{X}_space-fsLR_seg-<PARC>_den-91k_stat-mean_timeseries.ptseries.nii
         |     |_ sub-{ID}_ses-{V0X}-task-rest_dir-PA_run-{X}_space-fsLR_seg-<PARC>_den-91k_stat-pearsoncorrelation_boldmap.pconn.nii
         |     |_ sub-{ID}_ses-{V0X}-task-rest_dir-PA_run-{X}_space-fsLR_seg-<PARC>_stat-alff_bold.tsv
         |     |_ sub-{ID}_ses-{V0X}-task-rest_dir-PA_run-{X}_space-fsLR_seg-<PARC>_stat-coverage_bold.tsv
         |     |_ sub-{ID}_ses-{V0X}-task-rest_dir-PA_run-{X}_space-fsLR_seg-<PARC>_stat-mean_timeseries.tsv
         |     |_ sub-{ID}_ses-{V0X}-task-rest_dir-PA_run-{X}_space-fsLR_seg-<PARC>_stat-pearsoncorrelation_relmat.tsv
         |     |_ sub-{ID}_ses-{V0X}-task-rest_dir-PA_run-{X}_space-fsLR_seg-<PARC>_stat-reho_bold.tsv
         |
         |_ figures/
         |_ sub-{ID}_ses-{V0X}_executive_summary.html
         |_ sub-{ID}.html

# Label Values Legend
<APARC> (anat/ parcellations): 4S-<156|256|...|1056>Parcels, Glasser, Gordon, MIDB, MyersLabonte
<PARC> (func/ parcellations): 4S-<156|256|...|1056>Parcels, Glasser, Gordon, MIDB, MyersLabonte, HCP, Tian
Data Acquisition🔗
Whole-brain functional activity is measured by functional magnetic resonance imaging (fMRI). The blood oxygen level dependent (BOLD) signal is measured at each voxel in 2mm isotropic space with a repetition time (TR) of 1725 ms and multi-band (MB) factor of 4.
A minimum of two resting state (rs) fMRI runs are acquired during sleep (for infants <30 months old) lasting 7.5 minutes each (Figure 1A). FIRMM software (Dosenbach et al. 2017) is used to monitor motion, as quantified by framewise displacement (FD), in real time, and additional runs are acquired as needed to obtain a minimum total of 7.5 minutes of low-motion (FD <0.3 mm) data across runs (Figure 1B).
Each rsfMRI run is additionally preceded by acquisition of single shot spin-echo (SE) EPI images with same and reversed polarity phase encoding gradients with which to perform distortion correction (Figure 1C). Additional details are available at Dean et al. 2024.
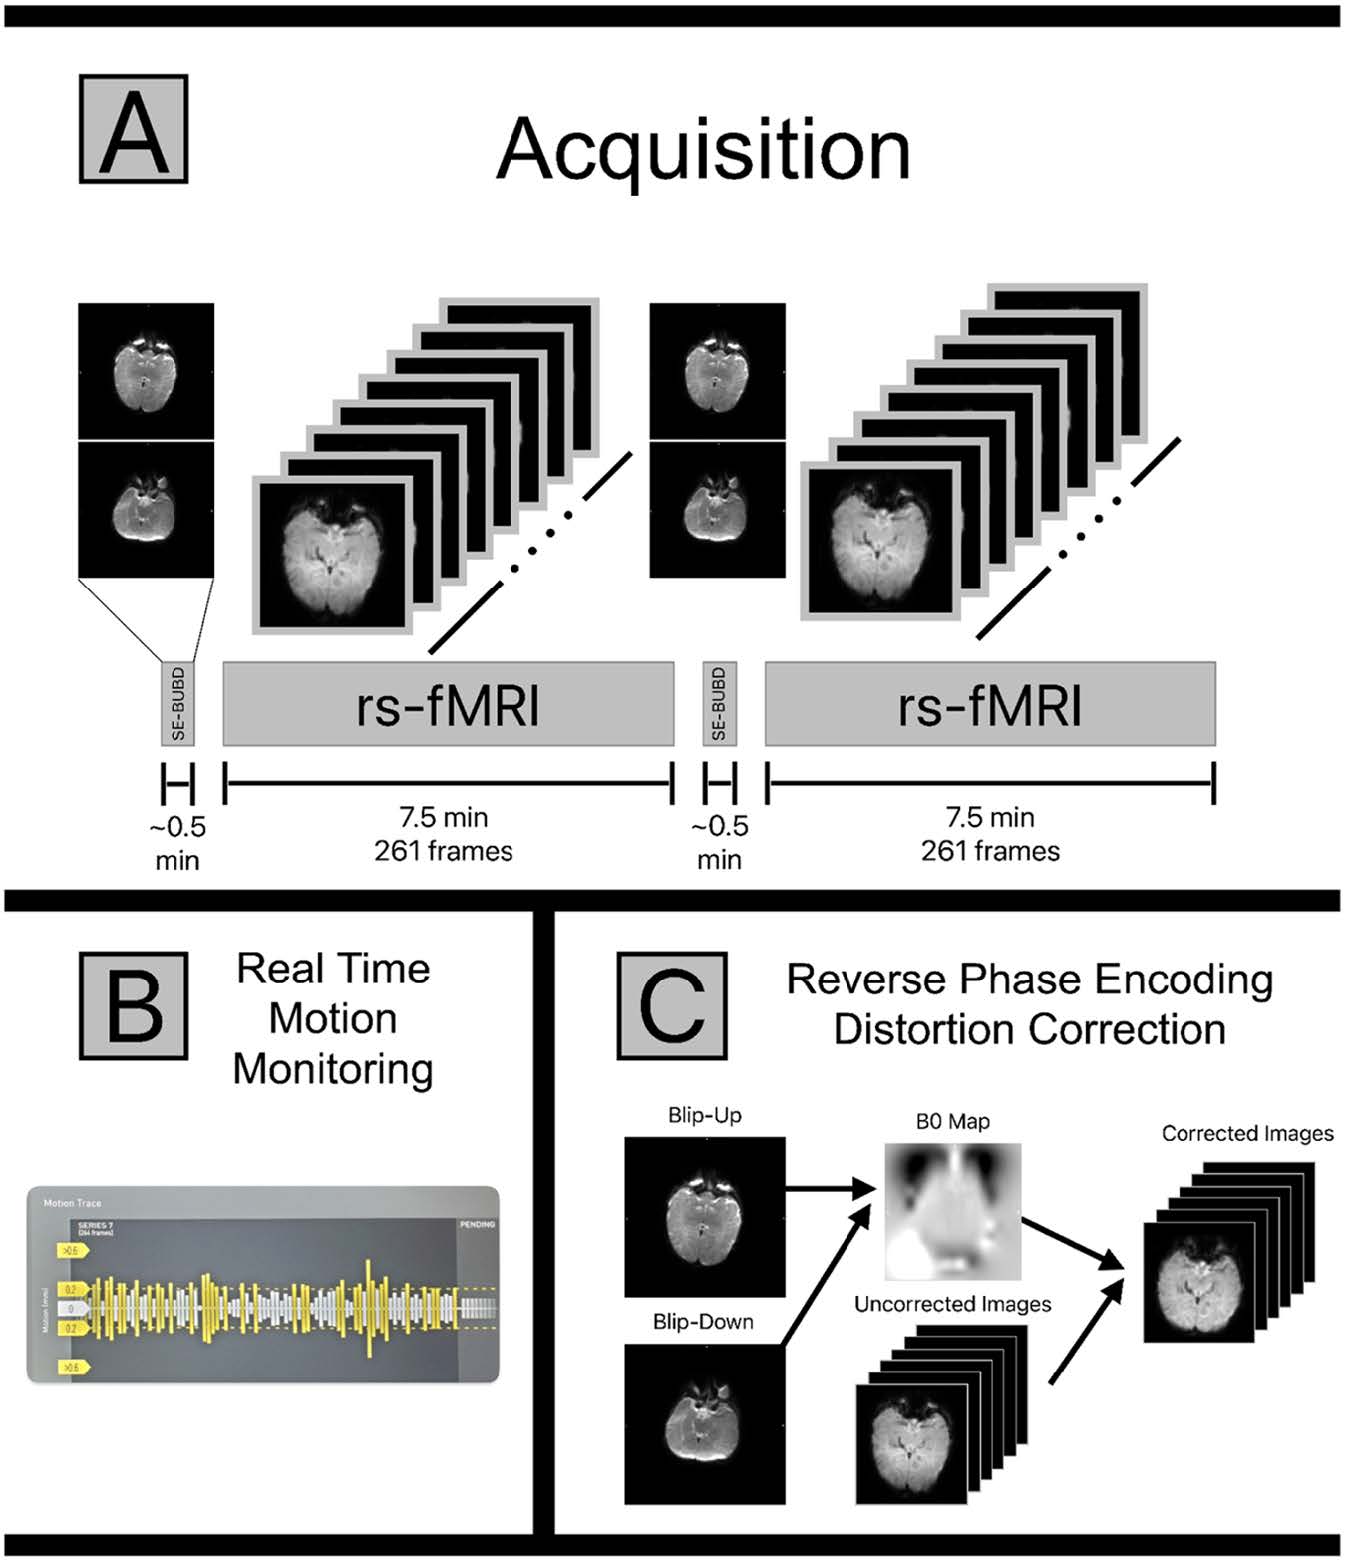
Figure 1. HBCD fMRI Acquisition Protocol (Dean et al., 2024)
Data Processing🔗
Functional MRI data is processed through infant-fMRIPrep and subsequently XCP-D as described in detail on the HBCD Processing webpage. In brief, infant-fMRIPrep produces minimally pre-processed outputs including confound files (with motion parameters, average signals for ROIs like CSF, etc.) and motion-corrected data in age-specific MNI volumetric atlas as well as fs_LR32k surface space. From these outputs, the XCP-D pipeline runs nuisance regression/denoising, parcellates the fMRI data, and computes summary measures.
Volumetric and surface-based time series will be made available for each subject. The data release also includes dense and parcellated time series with at least 2.5 minutes of low-motion data (FD>0.3), functional connectivity matrices, regional homogeneity values, and amplitude of low-frequency fluctuation values. All parcellated derivatives are generated from a variety of parcellation schemes. See the folder trees above for a full list of XCP-D and Infant fMRIPrep included in the release.
References🔗
Cosgrove KT, McDermott TJ, White EJ, Mosconi MW, Thompson WK, Paulus MP, Cardenas-Iniguez C, Aupperle RL. Limits to the generalizability of resting-state functional magnetic resonance imaging studies of youth: An examination of ABCD Study® baseline data. Brain Imaging Behav 16, 1919-1925, 2022. doi: 10.1007/s11682-022-00665-2
Dean III, D. C., Tisdall, M. D., Wisnowski, J. L., Feczko, E., Gagoski, B., Alexander, A. L., ... & HBCD MRI Working Group. (2024). Quantifying brain development in the HEALthy Brain and Child Development (HBCD) Study: The magnetic resonance imaging and spectroscopy protocol. Developmental Cognitive Neuroscience, 70, 101452. 10.1016/j.dcn.2024.101452
Dosenbach, N. U. F., Koller, J. M., Earl, E. A., Miranda-Dominguez, O., Klein, R. L., Van, A. N., Snyder, A. Z., Nagel, B. J., Nigg, J. T., Nguyen, A. L., Wesevich, V., Greene, D. J., & Fair, D. A. (2017). Real-time motion analytics during brain MRI improve data quality and reduce costs. NeuroImage, 161, 80-93. https://doi.org/10.1016/j.neuroimage.2017.08.025
Eggebrecht, A. T., Elison, J. T., Feczko, E., Todorov, A., Wolff, J. J., Kandala, S., Adams, C. M., Snyder, A. Z., Lewis, J. D., Estes, A. M., Zwaigenbaum, L., Botteron, K. N., McKinstry, R. C., Constantino, J. N., Evans, A., Hazlett, H. C., Dager, S., Paterson, S. J., Schultz, R. T., … Pruett, J. R., Jr. (2017). Joint attention and brain functional connectivity in infants and toddlers. Cerebral Cortex (New York, N.Y.: 1991), 27(3), 1709–1720. doi: 10.1093/cercor/bhw403
Fair, D. A., Schlaggar, B. L., Cohen, A. L., Miezin, F. M., Dosenbach, N. U. F., Wenger, K. K., Fox, M. D., Snyder, A. Z., Raichle, M. E., & Petersen, S. E. (2007). A method for using blocked and event-related fMRI data to study “resting state” functional connectivity. NeuroImage, 35(1), 396–405. doi: 10.1016/j.neuroimage.2006.11.051
Gratton, C., Dworetsky, A., Coalson, R. S., Adeyemo, B., Laumann, T. O., Wig, G. S., Kong, T. S., Gratton, G., Fabiani, M., Barch, D. M., Tranel, D., Miranda-Dominguez, O., Fair, D. A., Dosenbach, N. U. F., Snyder, A. Z., Perlmutter, J. S., Petersen, S. E., & Campbell, M. C. (2020). Removal of high frequency contamination from motion estimates in single-band fMRI saves data without biasing functional connectivity. NeuroImage, 217(116866), 116866. doi: 10.1016/j.neuroimage.2020.116866
Power, J. D., Barnes, K. A., Snyder, A. Z., Schlaggar, B. L., & Petersen, S. E. (2012). Spurious but systematic correlations in functional connectivity MRI networks arise from subject motion. NeuroImage, 59(3), 2142–2154. doi: 10.1016/j.neuroimage.2011.10.018
Power, J. D., Mitra, A., Laumann, T. O., Snyder, A. Z., Schlaggar, B. L., & Petersen, S. E. (2014). Methods to detect, characterize, and remove motion artifact in resting state fMRI. NeuroImage, 84, 320–341. doi: 10.1016/j.neuroimage.2013.08.048
Power, J. D., Schlaggar, B. L., & Petersen, S. E. (2015). Recent progress and outstanding issues in motion correction in resting state fMRI. NeuroImage, 105, 536–551. doi: 10.1016/j.neuroimage.2014.10.044
Pruim RHR, Mennes M, van Rooij D, Llera A, Buitelaar JK, Beckmann CF. ICA-AROMA: A robust ICA-based strategy for removing motion artifacts from fMRI data. Neuroimage 112, 267-277, 2015a. doi: 10.1016/j.neuroimage.2015.02.064
Pruim RHR, Mennes M, Buitelaar JK, Beckmann CF. Evaluation of ICA-AROMA and alternative strategies for motion artifact removal in resting state fMRI. Neuroimage 112, 278-287, 2015b. doi: 10.1016/j.neuroimage.2015.02.063
Ramduny, J., Uddin, L. Q., Vanderwal, T., Feczko, E., Fair, D. A., Kelly, C., & Baskin-Sommers, A. (2024). Increasing the representation of minoritized youth for inclusive and reproducible brain-behavior associations. bioRxiv. doi: 10.1101/2024.06.22.600221
Satterthwaite TD, Elliott MA, Gerraty RT, Ruparel K, Loughead J, Calkins ME, Eickhoff SB, Hakonarson H, Gur RC, Gur RE, Wolf DH. An improved framework for confound regression and filtering for control of motion artifact in the preprocessing of resting-state functional connectivity data. Neuroimage 64, 240-256, 2013. doi: 10.1016/j.neuroimage.2012.08.052
Siegel JS, Mitra A, Laumann TO, Seitzman BA, Raichle M, Corbetta M, Snyder AZ. Data Quality Influences Observed Links Between Functional Connectivity and Behavior. Cereb Cortex 27, 4492-4502, 2017. doi: 10.1093/cercor/bhw253